How the electric grid works
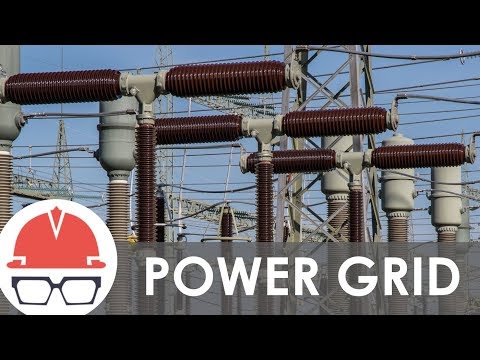 Photo: N43 and Hermes
The electric grid is the largest machine ever built. It generates electricity at power plants, steps voltage up for long-distance transmission, then steps it back down for distribution to homes and businesses. Supply must equal demand at every instant — with no buffer.
Video reference: How Does the Power Grid Work? — Practical Engineering. Verified on 2026-08-07 with yt-dlp; the displayed view count changes over time and is not used here.
01Generation: converting energy into electricity
Electricity is not a primary energy source — it is a carrier of energy. The grid begins at power plants, where primary energy — coal, natural gas, nuclear fission, wind, sunlight, falling water — is converted into electricity. The dominant method is thermal generation: fuel is burned to boil water, the steam drives a turbine, and the turbine spins a generator. A generator is a device that converts mechanical rotation into electricity by moving coils of wire through a magnetic field, inducing an electric current through electromagnetic induction. This is Faraday's law in practice: a changing magnetic field produces an electric current.
Most power plants — coal, gas, nuclear, geothermal, biomass — use the same basic architecture: heat boils water, steam spins a turbine, the turbine turns a generator. The differences are in the heat source. Coal and gas burn fuel directly. Nuclear plants use the heat from uranium fission. Geothermal plants use heat from deep underground. The steam cycle is remarkably similar across all of them. Renewable generators work differently: wind turbines use the wind to spin a rotor directly, and solar panels use the photoelectric effect to convert sunlight directly into electricity, with no turbine or steam cycle at all.
The generator's output is alternating current (AC), in which the direction of the current reverses 50 or 60 times per second depending on the country. The frequency — 60 Hz in North America, 50 Hz in Europe and most of Asia — is determined by the generator's rotational speed, which is precisely controlled. Maintaining this frequency is one of the grid's most critical tasks, as we will see.
02Step-up transformers and transmission lines
Once electricity is generated, it must be moved from the power plant to where it is needed. Power plants are often far from population centers — hydroelectric dams are in the mountains, nuclear plants are in remote areas, coal plants are near mines — and the electricity must travel hundreds of kilometers. The challenge is that transmission lines have resistance, and resistance causes power loss. The power lost as heat in a transmission line is proportional to the square of the current (P = I²R). To minimize losses, you must minimize the current.
This is why the grid uses high voltage for long-distance transmission. Power equals voltage times current (P = V × I), so for a given amount of power, higher voltage means lower current. A step-up transformer at the power plant raises the voltage from the generator's output (typically 10,000 to 25,000 volts) to transmission levels of 230,000 to 765,000 volts. At these voltages, the current is small enough that resistive losses are manageable — typically 2 to 5 percent over hundreds of kilometers. At lower voltages, the same transmission lines would lose most of the power as heat.
Transmission lines are carried by tall steel or concrete towers, strung with aluminum conductor steel-reinforced (ACSR) cable. The aluminum carries the current; the steel core provides tensile strength to support the cable's weight between towers. The lines operate at high voltages with bare conductors — no insulation — relying on air as the insulator between conductors and between conductors and the towers. This is why transmission towers are so tall and the conductors so widely spaced: the air gap must be large enough to prevent arcing at the operating voltage.
03The balancing act: supply must equal demand
The most remarkable fact about the electric grid is that supply must equal demand at every instant. Unlike water or gas, electricity cannot be stored in significant quantities in the grid itself. There are no "electricity tanks" — the electricity being used at any moment is being generated at that same moment. If demand exceeds supply, the frequency drops. If supply exceeds demand, the frequency rises. Both are dangerous. A frequency drop can cause generators to overload and trip off, cascading into a blackout. A frequency rise can damage equipment connected to the grid.
Grid operators maintain the balance in real time. They monitor the frequency continuously — in the United States, the target is 60.0 Hz with a tolerance of plus or minus 0.05 Hz — and adjust generation to match load. This is done in three layers. Base load plants — typically nuclear and large coal or gas plants — run at constant output around the clock. Intermediate or cycling plants adjust their output during the day to follow the daily demand curve. Peaker plants — typically gas turbines — can start and stop quickly to handle the highest demand periods, such as hot summer afternoons when air conditioning load peaks.
04Distribution: from substations to your outlet
The transmission system delivers electricity at high voltage to substations near population centers. At the substation, step-down transformers reduce the voltage from transmission levels (230,000+ volts) to distribution levels (typically 4,000 to 34,000 volts). From the substation, distribution lines fan out through neighborhoods, either overhead on wooden poles or underground in conduits.
At each neighborhood, a final transformer — the cylindrical gray can on a utility pole or the green box on the ground in underground-served areas — reduces the voltage to the service level that enters buildings: 120/240 volts in North America, 230 volts in Europe. This is the voltage that reaches your wall outlets. Each transformer serves a small number of buildings — typically 5 to 20 homes — and provides the final step-down in the voltage cascade from power plant to outlet.
The distribution system is where most grid outages occur. Trees fall on overhead lines, cars hit poles, squirrels chew through insulation, and equipment ages and fails. The transmission system is highly reliable — its tall towers and wide spacing make it resilient to most weather — but the distribution system, with its wooden poles and neighborhood-level exposure, is vulnerable. Modern grid modernization efforts focus heavily on distribution: automated switches, fault detection, and self-healing circuits that can reroute power around a fault in seconds rather than requiring a crew to drive to the site.
Voltage is stepped up for transmission and stepped down twice before reaching the consumer.
05Frequency and voltage: the grid's vital signs
Frequency and voltage are the grid's two vital signs. Frequency — 60 Hz or 50 Hz — is a measure of the balance between generation and load. If generation exceeds demand, the extra energy goes into speeding up the generators, and the frequency rises. If demand exceeds generation, the generators slow down, and the frequency drops. The frequency is therefore a real-time indicator of the grid's health, and it is the primary signal that grid operators use to control the system.
Voltage is a measure of the electrical "pressure" in the system. Unlike frequency, which is a single number for the entire grid, voltage varies by location — it is higher at the transmission level and lower at the distribution level, stepped up and down by transformers. But voltage also varies locally due to line resistance and reactive power. If the voltage drops too low, equipment stops working properly — lights dim, motors stall, electronics malfunction. If it rises too high, equipment can be damaged. Grid operators maintain voltage within tight tolerances using capacitor banks, voltage regulators, and generator excitation control.
Reactive power is a concept that confuses many people but is essential to grid operation. Reactive power is the portion of the power that oscillates back and forth between the source and the load without doing useful work. It is caused by inductive and capacitive elements in the system — motors, transformers, transmission lines themselves. While reactive power does not power devices, it is necessary to maintain voltage levels and to make the transmission system work. Grid operators must manage reactive power as carefully as real power, injecting or absorbing it as needed to keep voltage stable.
06Renewables and the challenge of intermittency
The traditional grid was designed for dispatchable generation — power plants that can increase or decrease output on command. Coal, gas, nuclear, and hydro plants can all be ramped up or down to match demand. Renewable energy — wind and solar — is fundamentally different. Wind turbines produce electricity when the wind blows, not when the grid needs it. Solar panels produce when the sun shines, not at night. This intermittency is the central challenge of integrating renewables into the grid.
When wind and solar are a small fraction of total generation, the grid can absorb their variability by adjusting the output of dispatchable plants. When the wind drops, a gas plant ramps up. When the sun sets, a hydro plant increases output. But as the renewable fraction grows — above 30 to 40 percent — the challenge becomes harder. The dispatchable plants may not be able to ramp fast enough, or there may not be enough of them. The grid needs flexibility: storage, demand response, interconnections to other grids, and flexible generation that can start and stop quickly.
Energy storage is the key technology for a high-renewable grid. Batteries — particularly lithium-ion batteries — can absorb excess renewable energy when production is high and release it when production drops. Pumped hydro storage, which pumps water uphill when excess power is available and lets it flow down through a turbine when power is needed, is the largest form of grid storage by capacity. Other technologies — compressed air, thermal storage, hydrogen — are in development. The grid of the future will be a system where generation, storage, and demand all work together to maintain the balance that dispatchable plants alone once maintained.
Solar generation creates a midday dip in net demand and a steep afternoon ramp as the sun sets — the "duck curve."
07Smart grids and the future of electricity
The grid is undergoing the most significant transformation since its creation in the 1880s. The traditional grid was a one-way system: electricity flowed from large central power plants through transmission and distribution lines to passive consumers. The smart grid is a two-way system: electricity flows in both directions, information flows alongside it, and consumers can also be producers. Rooftop solar panels feed electricity back into the grid. Batteries in electric vehicles can discharge power to the grid when needed. Smart meters communicate real-time consumption data to the utility, enabling dynamic pricing and demand response.
The smart grid adds a communication layer to the power layer. Sensors and controls throughout the system — from substations to smart meters in homes — report status, detect faults, and enable automated responses. When a tree falls on a distribution line, automated switches can reroute power around the fault in seconds, restoring service to most customers before a repair crew is even dispatched. This "self-healing" capability is one of the most immediate benefits of grid modernization, reducing the frequency and duration of outages.
The longer-term transformation is about the structure of generation. The traditional grid was built around large central power plants — a few hundred generators supplying millions of customers. The future grid will be built around distributed generation — millions of small generators (solar panels, wind turbines, batteries) supplying the same load. Managing this distributed system requires new control architectures, new market mechanisms, and new ways of thinking about reliability. The grid that Thomas Edison and Nikola Tesla built was a marvel of centralized engineering. The grid of the future will be a marvel of distributed coordination — a network, not a hierarchy.
By N43 and Hermes for Sailor Bob News.


