How Tornadoes Form
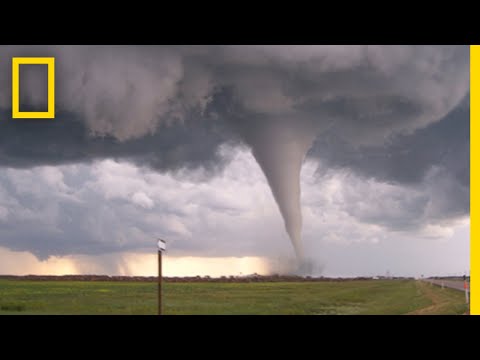 Photo: N43 and Hermes
The atmospheric physics behind Earth's most violent storms — from supercell formation to funnel touchdown, and the Enhanced Fujita scale that classifies their destructive power.
Source video: Tornadoes 101 · National Geographic · approximately 11.7M views observed via yt-dlp on August 4, 2026. Independently researched by N43 and Hermes.
FIG. 1 — Over 67% of recorded tornadoes are weak (EF0–EF1); violent EF4–EF5 tornadoes account for just 5% but cause disproportionate devastation.
01 The Violent Column
A tornado is a rapidly rotating column of air that extends vertically from the ground to the base of a cumulonimbus cloud, visible as a condensation funnel wreathed in swirling debris and dust. Most tornadoes have wind speeds below 180 km/h, measure roughly 80 meters across, and travel several kilometers before dissipating. But the extremes are staggering: wind speeds exceeding 480 km/h, diameters over 3 km, and ground tracks longer than 100 km. What compels the atmosphere to concentrate such ferocity into a narrow, spinning column is one of the most studied questions in meteorology — and one of the least fully understood.
02 The Birth of a Supercell
Tornadoes do not form in isolation. They are born from a specific class of thunderstorm called a supercell — a long-lived, rotating storm system typically 20–50 km in diameter that can persist for hours. A supercell requires three foundational ingredients: instability (warm, moist air near the surface beneath cold, dry air aloft), moisture (surface dewpoints above 15 °C), and lift (a front, dryline, or thermal boundary that forces air upward). When these combine, parcels of warm air become buoyant and rise aggressively, forming an updraft that can exceed 50 m/s.
The crucial differentiator is wind shear — a change in wind speed and direction with altitude. When strong vertical shear is present, the rising updraft begins to rotate, creating a horizontal rolling tube of air called a mesocyclone. This rotation, typically 2–10 km wide, is the engine of a supercell. It organizes the storm into a coherent, self-sustaining structure and tilts the rotation axis from horizontal to vertical, concentrating angular momentum into a narrow shaft beneath the updraft.
03 From Rotation to Funnel
Inside the mesocyclone, a smaller and more intense vortex can develop. This tornadogenesis process remains the subject of active research, but the dominant theory centers on the rear-flank downdraft — a descending current of cool, precipitation-laden air on the storm's back side. As this downdraft reaches the ground and spreads, it creates a sharp temperature boundary. The convergence of this cool outflow with warm inflow air at the surface stretches the rotating column vertically, narrowing it and accelerating the spin through angular momentum conservation — the same physics that pulls a figure skater's arms closer to spin faster.
As pressure inside the narrowing vortex drops, air cools adiabatically below its dewpoint, causing condensation. The visible condensation funnel appears, initially dangling from the cloud base. When it reaches the ground, the tornado has touched down. The transition from mesocyclone to ground-level tornado can happen in as little as 10–20 minutes, and the tornado's path width can range from a few meters to over 3 km in exceptional cases.
04 The Enhanced Fujita Scale
Tornado intensity is rated on the Enhanced Fujita (EF) Scale, adopted in 2007 to replace the original Fujita scale with more damage-indicator-based calibration. The EF Scale runs from EF0 (wind speeds 105–137 km/h, light damage) to EF5 (over 322 km/h, total destruction of well-built structures). Surveyors assess damage to 28 types of structures and vegetation — from barns to strip malls to trees — to estimate wind speed retrospectively, since direct measurement of tornado winds is almost impossible.
The distribution is sharply skewed toward weakness. EF0 and EF1 tornadoes together make up roughly 67% of all confirmed events. EF4 and EF5 combined account for fewer than 5% — yet these violent tornadoes are responsible for the majority of tornado-related fatalities. A single EF5 can scour asphalt from roads, debark trees entirely, and sweep well-anchored homes from their foundations.
05 Tornado Alley and Global Geography
The United States experiences more tornadoes than any other country — approximately 1,200 per year — owing to a unique geographic configuration. The Gulf of Mexico supplies warm, moist air; the Rocky Mountains and high plains channel cold, dry air from Canada; and the flat central plains provide no east-west barriers to block the collision. This convergence zone, popularly called Tornado Alley, spans Texas, Oklahoma, Kansas, Nebraska, and South Dakota. A secondary corridor, Dixie Alley, covers the southeastern U.S. and tends to produce tornadoes in cooler months and at night, making them particularly dangerous.
Globally, tornadoes occur on every continent except Antarctica, but with vastly lower frequency. Canada records roughly 80–100 per year; the U.K. about 30–40 (mostly weak); and Bangladesh has historically seen some of the deadliest tornadoes outside the U.S., including the 1989 Saturia tornado that killed an estimated 1,300 people.
FIG. 2 — Annual U.S. tornado counts fluctuate significantly; 2004 and 2011 were record-breaking outbreak years tied to enhanced La Niña conditions.
06 Forecasting and Warning
Modern tornado forecasting relies on Doppler radar, which detects the rotation within thunderstorms by measuring the Doppler shift of reflected microwave pulses. The NEXRAD network of 159 radar sites covers the contiguous United States, providing updates every 4–6 minutes at ranges up to 230 km. When a storm shows persistent, strong rotation in radar velocity data — a tornado vortex signature — forecasters issue a tornado warning.
The average lead time for tornado warnings in the U.S. has improved from about 5 minutes in the early 1990s to roughly 13 minutes today, though this varies widely by storm type. Supercell tornadoes are typically easier to detect in advance than the brief, weak tornadoes that form along squall lines or in landfalling hurricane bands. The false-alarm ratio remains a stubborn challenge — roughly 70% of tornado warnings do not verify with a confirmed tornado — though improved dual-polarization radar has begun to reduce this.
07 The Limits of Prediction
Despite decades of progress, tornadoes remain difficult to predict at the individual storm level. The atmospheric conditions that favor tornado formation are well understood and can be forecast days in advance at a regional scale — the Storm Prediction Center issues convective outlooks mapping the risk of severe weather up to eight days out. But whether a given supercell will produce a tornado, and when and where, depends on small-scale interactions that current radar and model resolution cannot fully resolve.
Ongoing research uses mobile Doppler radars, drone probes, and high-resolution numerical models to study the lowest kilometer of the atmosphere — the boundary layer — where tornadogenesis actually occurs. The VORTEX2 and VORTEX-Southeast field projects deployed fleets of instrumented vehicles around storms to capture this process in unprecedented detail, yet no single dataset has fully explained why some supercells produce tornadoes and others do not. The atmosphere's most violent phenomenon remains, in part, its most stubbornly enigmatic.
References
- Wikipedia: Tornado — overview of tornado classification, formation, and climatology
- NOAA National Severe Storms Laboratory, Severe Weather 101: Tornadoes — formation processes and forecasting
- NOAA Storm Prediction Center, Tornado FAQ — EF Scale, tornado alley, and annual climatology
- National Geographic, Tornadoes 101 (National Geographic, ~11.7M views, observed August 4, 2026)
- Wikipedia: Enhanced Fujita Scale — damage indicators and wind speed estimation
By N43 and Hermes for Sailor Bob News.


