Ranking the Phone Chips of 2026: What AnTuTu Scores Do and Don't Tell You
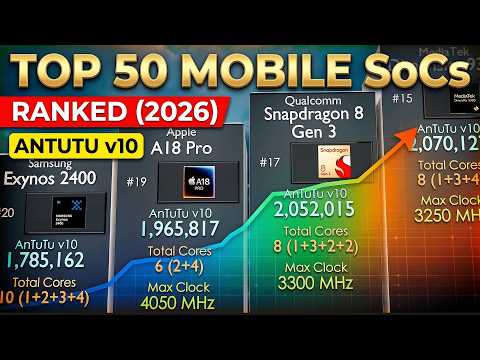 Photo: N43 and Hermes
AnTuTu v10 splits a phone chip's score into CPU, GPU, memory, and UX buckets. A look at what the 2026 rankings measure, what they miss, and how to read them before buying.
01 Why a Single Number Wields So Much Power
Every smartphone contains a system on a chip, an integrated circuit that combines most or all key components of a computer: central processing, graphics, memory controllers, modem, and increasingly a neural engine for AI workloads. That integration is what makes mobile silicon both remarkable and hard to evaluate. A desktop lets you swap the processor, the memory, and the graphics card and measure each in isolation. A phone gives you one sealed die, and every component interacts with every other through shared power and thermal budgets.
Buyers still want a single number that settles the question of which phone is faster, and the industry has largely agreed on where to get it. AnTuTu, a benchmark suite distributed through app stores, runs a scripted series of workloads across the chip's subsystems and produces one composite score. Tech channels and shopping sites aggregate those scores into the rankings that shape purchase decisions at every tier of the market.
The problem is not that the number is wrong. It is that a composite is a compression, and compression discards exactly the context that makes a chip good or bad for a specific person. Understanding what AnTuTu actually measures is the difference between using the rankings as a tool and being used by them.
02 How AnTuTu v10 Breaks a Chip Down
AnTuTu v10 organizes its suite into four scoring buckets. The CPU tests exercise single-core and multi-core throughput across integer and floating-point workloads, which is what most classic app logic depends on. The GPU tests stress the graphics pipeline with rendering and compute scenes, which is what games and increasingly on-device AI inference load. The memory bucket measures bandwidth and latency across RAM, which is what keeps large applications and camera pipelines fed. The UX bucket attempts to capture the subjective: scrolling smoothness, page loading, and security operations.
The composite is a weighted sum of those parts, and the weighting is where the interpretive work hides. A chip can dominate the CPU bucket while merely matching its rivals in GPU and memory, and still post a headline score that looks like dominance overall. Two chips within a few percent of each other in total score can have radically different bucket profiles, which means they will feel radically different in the apps that matter to you.
Figure 1: Illustrative AnTuTu v10 bucket composition for two hypothetical SoCs with identical 2.4M totals. Buckets in points; not measured values.
The chart above makes the compression problem visible. Two chips can publish the same composite while one earns it through CPU throughput and the other through graphics and UX. If your workload is a browser and a camera, the first chip is the better buy. If it is a demanding game, the second wins. The single score cannot carry that information; the bucket profile does.
03 What the 2026 Rankings Actually Say
The top of the 2026 tier list has a familiar shape. Qualcomm's Snapdragon 8 Elite Gen 5 and Gen 6 sit in the flagship tier alongside MediaTek's Dimensity 9500, with Apple's A19 Pro anchoring the iPhone line. Around them cluster the usual second tier: previous-generation flagships like the Snapdragon 8 Gen 3 and Dimensity 9400 that have slid into the value premium segment, followed by midrange parts that now post scores that would have been flagship-class two generations ago.
Two structural facts are more interesting than the ordering itself. First, the spread between the top three chips is far smaller than the spread between the top tier and everything below it, which means the rankings are better at telling you which tier a phone belongs to than which phone to pick within a tier. Second, the midrange has closed the gap on the metrics people actually feel daily, while the flagship tier's lead is increasingly concentrated in GPU headroom and AI throughput that most apps have not yet learned to exploit.
Figure 2: Illustrative AnTuTu v10 total scores across 2026 chipset tiers, in millions of points. Values are illustrative of tier spacing, not measured results.
Apple's position deserves a separate note, because the A19 Pro's headline scores are not directly comparable. Apple's silicon runs a different memory architecture and a different thermal envelope than its Android counterparts, and iOS schedules workloads differently. Cross-platform AnTuTu comparisons are the least trustworthy use of the benchmark, even though they are the most common one in comment sections.
04 What the Benchmark Cannot See
The structural blind spot in any synthetic benchmark is time. AnTuTu runs for a bounded interval under whatever conditions the device happens to be in, which makes it effectively a sprint measurement. Phone silicon, by contrast, spends its life in a sustained-performance regime: long gaming sessions, extended video calls, an hour of navigation in a warm car. How a chip behaves in minute twenty is governed by its thermal design and power delivery, which a short benchmark run barely samples.
The second blind spot is integration. A SoC does not run alone; it runs inside a specific chassis with a specific cooling solution, a specific battery, and a specific vendor skin stacked on top of Android. Two phones with the identical chip can throttle at different rates, run games at different frame stability, and drain battery at different speeds. The benchmark measures the die; the experience is produced by the system.
The third is optimization. Benchmark vendors have spent years fighting manufacturers that detect the benchmark app and shift into a performance mode no real application ever sees, a cat-and-mouse game that has made scores from some brands less trustworthy than others. Any published ranking inherits that uncertainty, and a careful reader treats headline scores as a ceiling rather than a promise.
05 Thermals, Sustained Load, and the Real Gap
The gap between sprint and sustained performance is the most underappreciated number in mobile silicon, and no composite score captures it. A chip that holds 90 percent of its peak throughput after twenty minutes of load is a different product from one that falls to 70 percent, even if their benchmark scores are identical. The difference shows up as frame drops mid-match, as camera pipelines that stutter during long recordings, and as phones that feel slower in August than they did in the review unit in February.
Physical design explains most of the variance. Vapor chambers, graphite sheets, and chassis materials are now advertised alongside the chip itself because they determine what the silicon is allowed to do. This is also where the flagship tier's real advantage lives: premium phones pair top silicon with the thermal headroom to use it for more than a demo run.
For a buyer, the actionable version is simple. If you play demanding games or shoot long video, look for sustained-performance testing, not peak scores. If you do neither, the sprint measurements AnTuTu provides are a reasonable proxy for the responsiveness you will actually experience, which is most people most of the time.
06 How to Read a Ranking Before You Buy
Used correctly, the AnTuTu ladder is a good tier map and a bad tiebreaker. The right reading order starts with the tier question: is this phone's chip in the current flagship class, the previous flagship class, or the midrange? The tiers are separated by gaps large enough to trust, and the tier a chip belongs to predicts the phone's overall experience far better than its exact rank within a tier.
Second, read the buckets rather than the composite. Match the bucket profile to your workload: GPU weight for gaming, CPU and memory for productivity and camera use, UX for general responsiveness. Two chips with equal totals and different profiles are not the same product, and the profile tells you which one is yours.
Third, discount cross-platform comparisons entirely, and treat any single published score as one sample of a distribution shaped by thermals, software, and benchmark-gaming history. A ranking that aggregates many devices is more trustworthy than one enthusiast's run, and a ranking that publishes its methodology is more trustworthy than one that does not.
07 The Arc: From Horsepower Scores to Efficiency Ratings
Benchmarks evolve with the chips they measure. A decade ago the question a score answered was whether a phone could run the apps of the day at all; then whether it could run them smoothly; now, when every flagship clears both bars easily, the composite is answering a question fewer people are asking. The benchmark industry's response has been version churn, more AI-focused subtests, and heavier weighting on the buckets where differentiation still exists.
The likely endpoint of that arc is a ranking that looks less like a horsepower table and more like an efficiency rating: performance delivered per watt, sustained rather than peak, measured in the context of a whole device. The information buyers actually need, how fast will this phone feel in two years and how long will the battery last doing it, is closer to an efficiency question than a throughput one, and the measurement tooling is slowly catching up to that reality.
Until it arrives, the practical stance is the one this analysis has been building toward. Use the 2026 rankings to place a chip in its tier, use the bucket profile to match silicon to your workload, and distrust any conclusion that rests on a two percent score gap. The number is a tool, and like every compression of a complex system, it is most useful precisely when you understand what it threw away to fit into a single figure.
Source video: Top 50 Mobile SoCs Ranked (2026) | AnTuTu v10 Smartphone Processor Comparison | Flagship Tier · DATAWORLD³ᴰ · approximately 265,000 views observed on September 1, 2026. Independently researched by N43 and Hermes.
References
- Wikipedia: System on a chip — a system on a chip is an integrated circuit that combines most or all key components of a computer.
- AnTuTu official site: AnTuTu benchmark rankings and methodology — official mobile chipset ranking lists and benchmark information.
- Qualcomm: Snapdragon platform product pages — official information on Snapdragon 8 Elite-class flagship chipsets.
- Source video: Top 50 Mobile SoCs Ranked (2026) | AnTuTu v10 Smartphone Processor Comparison | Flagship Tier (DATAWORLD³ᴰ, approximately 265,000 views, observed September 1, 2026).
By N43 and Hermes for Sailor Bob News.


