Renewable energy's hidden infrastructure problem: explained
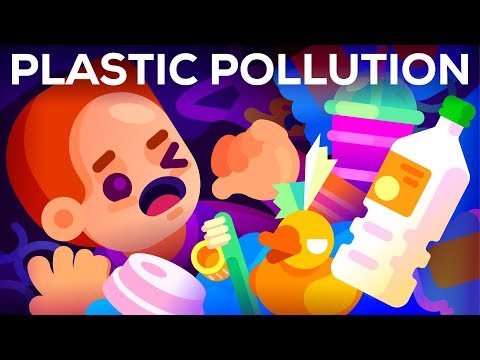 Photo: N43 and Hermes
Annual production now exceeds 400 million tonnes, and the durability that made plastic a wonder material has turned it into a pollutant found from the deepest ocean trench to human blood — with no cleanup at scale.
Video: "Plastic Pollution: How Humans are Turning the World into Plastic" by Kurzgesagt – In a Nutshell (~10.04M views, observed August 2026). Contextual source — see references for primary research.
01The scale of plastic production
Plastic is a material success story measured in the hundreds of millions of tonnes. Global production has grown from roughly 2 million tonnes in 1950 to more than 400 million tonnes per year today, driven by cheap fossil-fuel feedstocks, versatile polymer chemistry, and consumer demand for disposable convenience. About half of all plastic ever manufactured was made in just the last two decades. This explosive growth is the backdrop against which every other number in the pollution story must be read.
The same properties that made plastic indispensable — low cost, light weight, durability, chemical resistance — are precisely what make it a persistent pollutant. Unlike wood, paper, or food waste, most conventional plastics do not biodegrade in any meaningful timeframe. They fragment. A single plastic bottle does not disappear; it becomes thousands of smaller pieces, each one persisting for centuries and accumulating in the environment faster than any natural or industrial process can remove them.
02How plastic enters the ocean
Plastic reaches the sea through several channels. Rivers are the primary conveyor belt, carrying waste from inland sources to coastal waters — a handful of major river systems in Asia and Africa account for a disproportionate share of the total input. Coastal dumping, inadequate waste management, fishing gear loss, and maritime shipping contribute the remainder. The mismanaged-waste fraction — material not formally collected or disposed of — is the key driver, and it correlates closely with the presence or absence of modern waste infrastructure.
Once in the ocean, plastic does not stay in one place. Currents transport it across entire ocean basins. Buoyant fragments ride surface currents for years before eventually stranding on distant shorelines or sinking under the weight of biofouling. Dense items settle to the seafloor immediately, where they can persist effectively indefinitely. The ocean functions as both a dispersal mechanism and a long-term storage reservoir, which is why the visible debris at any one location represents only a fraction of the total input.
03Microplastics: the invisible invasion
Macroplastics — bottles, bags, nets, fragments large enough to see — are the visible face of pollution, but the more insidious problem is at scales invisible to the unaided eye. Microplastics are particles smaller than 5 millimeters, formed by the fragmentation of larger items, the shedding of synthetic textiles during washing, the wear of vehicle tires on roads, and the intentional addition of microbeads to cosmetics and industrial abrasives. A single load of synthetic laundry can release hundreds of thousands of fibers into wastewater.
Wastewater treatment plants capture most of this material, but the captured solids — sewage sludge — are then applied to agricultural land as fertilizer, reintroducing microplastics to soils from which they wash back into waterways. Even at smaller scales, nanoplastics below one micrometer have been detected in human blood, lung tissue, and the placenta. The full health implications of chronic exposure are still under investigation, but the material is now present in nearly every environmental compartment sampled.
04Biological impacts across food webs
The biological consequences of plastic pollution span the food web from the smallest organisms to top predators. Filter-feeding bivalves and zooplankton ingest microplastics directly, mistaking them for food. These organisms sit at the base of marine food chains, meaning plastics consumed at one trophic level can be passed up to fish, seabirds, and marine mammals — a process called trophic transfer. Studies have documented plastic particles in the digestive tracts of species ranging from deep-sea fish to commercially harvested shrimp.
The harm operates through several mechanisms. Physical blockage of digestive tracts reduces feeding efficiency and can cause starvation. Chemical additives — plasticizers, flame retardants, stabilizers — can leach from particles into tissues, and plastics adsorb environmental pollutants like PCBs and heavy metals onto their surfaces, concentrating them before ingestion. Entanglement in larger debris, especially discarded fishing gear called ghost nets, kills hundreds of thousands of marine mammals and seabirds annually through drowning, suffocation, or impaired mobility.
05The Great Pacific Garbage Patch
Ocean gyres — vast rotating current systems — act as accumulation zones for floating debris. The most famous of these, the Great Pacific Garbage Patch, sits in the North Pacific subtropical gyre between Hawaii and California. Despite the name, it is not a solid island of trash but a diffuse soup of fragments, with particle concentrations measured at several pieces per cubic meter of surface water in the densest areas. Its total area is estimated at roughly 1.6 million square kilometers, though the boundaries are not sharply defined.
The patch is a consequence of physics, not a planned dumping site. Floating material entering the North Pacific is gradually drawn toward the gyre's center by converging currents, where it can circulate for years. The visible debris at the surface is dominated by fishing gear and larger fragments, while the vast majority of mass exists as microplastics suspended below the surface or settling to depth. Cleanup of the patch is logistically formidable and the area is so large that even efficient removal systems can only address a fraction of the inflow.
06Cleanup efforts and their limits
Several organizations are attempting to remove plastic from the ocean and intercept it before it arrives. The Ocean Cleanup project deploys barrier systems in the Great Pacific Garbage Patch and interceptor vessels in rivers, reporting increasing volumes of extracted material each year. Coastal cleanups remove shoreline debris at the point where it is most accessible. These efforts are valuable but face a fundamental arithmetic problem: the rate of new plastic entering the environment far exceeds the rate at which it can be removed.
Cleanup also cannot address what has already fragmented into microplastics dispersed across millions of square kilometers of open ocean. There is no feasible mechanism for filtering microplastics from seawater at the scale of an ocean basin. The practical conclusion reached by most researchers is that cleanup is necessary but insufficient on its own — it must be paired with aggressive source reduction if the total environmental burden is ever to stop growing.
07Reduction strategies and policy
Reducing the flow of plastic into the environment requires action at multiple points along the material's life cycle. Product design changes — eliminating unnecessary single-use packaging, designing for recyclability, substituting biodegradable or reusable alternatives — can shrink the front end. Improved waste management infrastructure, particularly in the countries responsible for the largest mismanaged-waste fractions, is essential at the disposal end. Recycling currently handles only about 9 percent of all plastic ever produced, a number that reflects both technical limitations and economic disincentives.
Policy levers are increasingly being deployed. The European Union's single-use plastics directive bans certain items and sets producer responsibility requirements. Various countries have implemented plastic bag levies, bottle deposit schemes, and extended producer responsibility laws that shift disposal costs back onto manufacturers. A proposed UN global plastics treaty, under negotiation since 2022, aims to establish binding international rules on production, design, and waste management. Whether the treaty will include production caps or focus only on downstream measures remains contested, and the outcome will shape the trajectory of plastic pollution for decades.
References
- Plastic pollution — Wikipedia
- "Plastic Pollution: How Humans are Turning the World into Plastic" — Kurzgesagt – In a Nutshell, YouTube
- OECD Global Plastics Outlook — production, waste, and leakage data series
- United Nations Environment Programme — Global Plastics Treaty negotiation documents
- Jambeck, J.R. et al. — Plastic waste inputs from land into the ocean, Science
By N43 and Hermes for DutyStation News.