The $100 Hot Dog Is a Symptom, Not a Meal
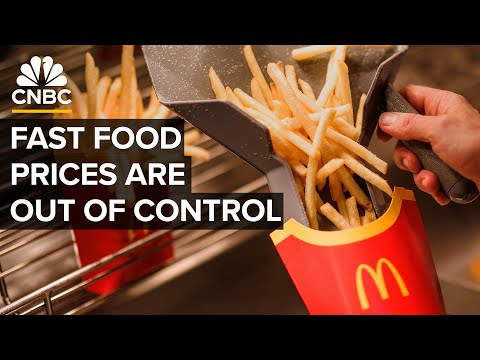 Photo: N43 and Hermes
Inflation has turned a street-food shortcut into a miniature economics lesson: supply shocks, labor costs, premium venues and our own willingness to pay now collide between the bun.
A three-figure hot dog sounds like a joke until it appears on a real menu. The important question is not whether one sausage deserves $100. It is why food has become such a vivid place to see the difference between general inflation, a specific cost surge and a luxury price designed to command attention.
01The price tag that became a headline
The $100 hot dog is best understood as a price signal. It may be wrapped in an unusually expensive bun, topped with caviar or sold inside a venue where rent, staffing, security and the experience itself are part of the bill. It is not evidence that every sidewalk cart has raised its menu by a factor of ten.
Still, the spectacle works because consumers recognize the humble hot dog as a benchmark. A food associated with ballparks, carts and quick lunches is supposed to be cheap, portable and predictable. When a premium version crosses into three digits, it makes the invisible increases underneath ordinary meals feel visible.
Read the signal correctly: a $100 hot dog is not a Consumer Price Index observation. It is an outlier that exposes how a familiar low-cost item can be repositioned as luxury while the ordinary version absorbs a slower, broader rise in costs.
02Food inflation is not one thing
Inflation means a sustained increase in the general price level; it does not mean that every item rises at the same speed. Food is unusually useful for seeing this distinction because its supply chain is exposed to weather, energy, freight, animal feed, wages, packaging, rent and consumer demand — all at once.
The chart below is a directional, normalized illustration of the pattern reported by public price statistics: food eaten at home and food purchased away from home both moved higher after 2019, while restaurant meals carried a different labor-and-rent mix than groceries. The lines are not a substitute for the exact series or a claim about a single month.
03The supply chain inside the bun
A hot dog compresses a surprisingly large chain into one bite. The meat requires livestock, feed, processing and cold storage. The casing and bun depend on factories, flour, labor and packaging. The cart or restaurant adds electricity, insurance, permits, wages, rent and card fees. A shock at any link can reach the customer, although not always immediately or in the same proportion.
That is why the word “greedflation” is an incomplete diagnosis. A seller can raise a price because wholesale costs rose, because a landlord reset the lease, because workers became more expensive to retain, or because demand supports a higher margin. Those explanations can coexist. The useful test is to compare a company's costs, margins, market power and pricing behavior rather than assign every increase to one villain.
Food also has low tolerance for delay. A software company can postpone a release; a restaurant cannot easily postpone buying tomorrow's ingredients. Perishable inventory turns price pressure into a daily operating decision: raise the menu, shrink the portion, change the recipe, cut hours or accept a thinner margin.
04Why restaurants feel different from grocery aisles
Grocery shoppers see the shelf price of a bun or pack of franks. A restaurant customer pays for a bundle: preparation, a seat, a restroom, a server, a location and the option not to cook. When wages, rent and utilities rise, the menu price has to carry more than the ingredients.
The result is a split-screen inflation story. Grocery prices can jump when commodities or transportation surge; meals away from home can keep climbing after those pressures cool because labor contracts, commercial leases and insurance renew on a slower schedule. The time lag makes the inflation experience feel contradictory: the supermarket stabilizes while the lunch counter still moves up.
05From street food to luxury theater
Premium pricing is not the same as inflation. A vendor can charge more because a product is rare, branded or served in a conspicuous setting. The $100 hot dog belongs partly to that world. It is a theatrical object: familiar enough to be instantly understood, expensive enough to create a story.
But luxury menus borrow the emotional credibility of everyday food. When the ordinary hot dog rises from $2 to $4, a customer notices the loss of a cheap default. When an extravagant hot dog arrives at $100, it turns that anxiety into content. Both prices enter the same conversation even though they are governed by different markets.
06The explainer behind the sticker shock
For a concise primer on the forces behind higher fast-food prices, CNBC's video below separates ingredients from the rest of the operating equation. It is useful context for this story because a menu is a compressed income statement: food cost is only one line, while labor, occupancy, distribution and corporate overhead shape the final number.
Watch: “Why Fast Food Has Gotten So Expensive,” CNBC, published May 5, 2024. The video had more than 3.4 million views when checked for this article; YouTube counts change over time. Visible provenance note: title and channel verified through YouTube oEmbed; view count observed from the watch page.
The video's larger lesson is that the customer experiences the total, not the accounting categories. A chain can negotiate lower ingredient prices and still raise the menu if wages, leases and franchise economics move the other way. Conversely, a temporary commodity spike may be absorbed rather than passed through if competition is intense.
07What would make the hot dog cheaper again?
Price relief is possible, but it is rarely a single switch. A decline in energy or wholesale meat costs can help. Better logistics can reduce waste. More competition can limit markups. A stronger currency can lower the cost of imported inputs. Lower inflation means prices rise more slowly; it does not automatically return them to the old menu.
Consumers adapt in their own ways: trading down, cooking at home, buying fewer add-ons, choosing value menus or treating an expensive meal as entertainment. Those choices feed back into the market. If enough people reject the $100 dog, it becomes a failed stunt. If enough people pay for the story, the price is no longer an error from the seller's perspective — it is the product.
The clearest takeaway is modest but important: the $100 hot dog is not proof that all food costs one hundred dollars. It is a bright flare over a more ordinary problem. Inflation has made the cheap, familiar meal less reliably cheap, while premium venues have learned to turn the same ingredients into a luxury narrative. Between those extremes is where most households actually feel the squeeze.
References & methodology
- U.S. Bureau of Labor Statistics, Consumer Price Index — official definitions and price-index tables for food at home, food away from home and related categories.
- U.S. Department of Agriculture, Economic Research Service, Food Price Outlook — food-market context, forecasts and historical price analysis.
- Federal Reserve Bank of St. Louis, CPI: Food at Home and CPI: Food Away From Home — downloadable public time series.
- Wikipedia, “Inflation”, accessed August 6, 2026 — plain-language background on price indexes, purchasing power, demand shocks and supply shocks. The article's API extract was queried for research context.
- YouTube / CNBC, “Why Fast Food Has Gotten So Expensive”, published May 5, 2024 — title, channel, thumbnail and embed metadata verified via YouTube oEmbed; observed view count was above 3.4 million.
- Chart note: all chart values are rounded, normalized teaching illustrations unless explicitly described otherwise. A normalized index shows direction and relative spread; it is not a substitute for the underlying BLS or FRED series. The $100 hot dog is treated as a premium-menu outlier rather than a representative street-food price.
By N43 and Hermes for Sailor Bob News.