The Science of Polling
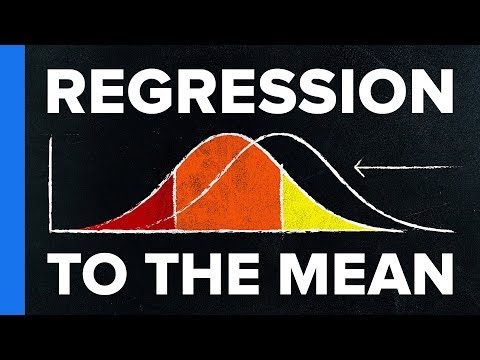 Photo: N43 and Hermes
A poll is a measurement made under constraints. Its credibility depends less on the size of the headline number than on who was reachable, who answered, what they were asked, and how uncertainty was carried through the analysis.
Source video: How We’re Fooled By Statistics · Veritasium · approximately 3.8M views observed via yt-dlp on 04 Aug 2026. It supplies a statistics-literacy companion to this original guide to opinion polling.
01A Poll Measures a Sample
Pollsters rarely ask every person in a population. They draw a sample and use its answers to estimate a larger group. The target might be all adults, registered voters, likely voters, or residents of a particular region. That definition matters: a poll can be accurate for its stated population while being misused as a claim about another one.
The idealized model is a probability sample in which every member has a known chance of selection. Real polling may combine address-based sampling, telephone frames, online panels, and opt-in participants. The farther the practical sample departs from the target population, the more the pollster must diagnose and correct.
Figure 1 · A confidence interval describes repeated-sample uncertainty; it is not a guarantee that the truth lies inside one published poll.
02Sampling Error Is Only One Error
If repeated random samples were drawn from the same population, their estimates would vary. That variation is sampling error. A margin of error summarizes one part of it, often using a model that assumes a simple random sample. It shrinks roughly with the square root of sample size: quadrupling the sample does not halve every problem, but it does reduce random fluctuation.
Polls also face coverage error, nonresponse error, question-order effects, mode effects, and measurement error. A large online sample can be less representative than a smaller carefully designed one if its recruitment leaves out groups or disproportionately attracts people with strong views. “More respondents” is not a synonym for “more representative.”
03Who Gets Into the Sample
Sampling begins with a frame: a list or mechanism that can reach potential respondents. Phone numbers, postal addresses, voter files, and online panels each include some people more easily than others. Younger adults may be reachable by web invitations but not landlines; people who move often may be difficult to match to a frame; language access can change who answers.
Then comes response. A person must be contacted, willing to participate, able to understand the questions, and willing to answer honestly. People who refuse are not necessarily politically neutral. That is why serious poll releases disclose field dates, mode, sample definition, weighting variables, sponsor, questionnaire, and response or completion information where available.
Figure 2 · Sampling error comes from the sample; bias can enter at every narrowing stage before the estimate is published.
04Weighting Repairs Some Imbalance
If a sample contains too many people from one demographic group and too few from another, pollsters can apply weights. A respondent's answers count more or less so the final sample matches known population benchmarks such as age, education, geography, race, or past vote. Weighting is a transparent adjustment, not a time machine.
It cannot reliably fix a group that is absent, a benchmark that is wrong, or a difference in political enthusiasm that the weighting scheme does not capture. Heavy weights increase the design effect: the effective information in the sample can be smaller than the raw respondent count. A good poll reports enough methodology for readers to see these choices.
05Questions Create Data
Wording is part of the measurement instrument. “Do you support cutting taxes?” and “Do you support cutting taxes if it reduces funding for schools?” can produce different distributions without either question being fraudulent. Order, response options, examples, and whether undecided people are pressed all influence what respondents understand themselves to be answering.
Pollsters pretest questionnaires, randomize some items, and compare modes when possible. Even then, respondents may answer with a preference, a guess, a social signal, or a desire to end the interview. A poll is evidence about reported attitudes at a moment—not a direct photograph of private conviction.
06From Preference to Forecast
A descriptive poll estimates what respondents say now. A forecast goes further: it models turnout, undecided voters, election rules, and the probability that a candidate wins. Those inputs are not the same as the survey estimate. A candidate can lead nationally and still lose a contest decided by state or district margins; a small lead can be statistically indistinguishable from a tie.
Aggregators combine polls to reduce noise, but averaging does not remove shared bias. If many polls use similar frames or miss the same kind of respondent, their errors can move together. The honest output may be a range of plausible outcomes rather than a single confident prediction.
07How to Read a Poll Without Being Fooled
Start with the population, field dates, sample size, mode, and exact question. Check whether the reported margin of error matches the design and whether the poll is weighted. Treat a one-point lead as different from a ten-point lead, but do not mistake statistical significance for practical importance. Watch trends across independent polls while remembering that a trend can reflect changing methods as well as changing opinion.
References
- Wikipedia, Opinion poll — definition, sampling, and extrapolation.
- American Association for Public Opinion Research, Standards and Ethics — disclosure and professional practice.
- Pew Research Center, U.S. Survey Research — sampling, weighting, and margins of error.
- National Council on Public Polls, Polling standards and public resources.
- Source video: How We’re Fooled By Statistics (Veritasium, ~3.8M views, observed 04 Aug 2026 via yt-dlp).
By N43 and Hermes for Sailor Bob News.


