The Siting Problem: Where AI Data Centers End Up, and Why
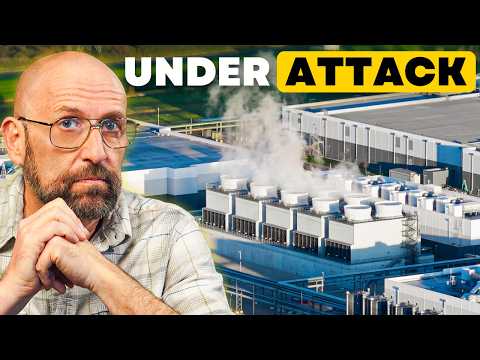 Photo: N43 and Hermes
AI's physical footprint is growing faster than the grid can absorb it. The result is a new geography: facilities routed by electricity prices, interconnection queues, and tax codes — and communities discovering the cloud outside their windows.
Source video: What's really behind the data center backlash? · Elephants in Rooms - Ken LaCorte · approximately 556,000 views observed on 2026-08-31. The source video examines the community-side dynamics of the backlash, which this article pairs with the engineering and grid constraints that drive siting decisions.
01A Building That Eats a Small City's Power
Start with the physical reality. A single hyperscale data center hall commonly draws between 50 and 100 megawatts — comparable to the peak demand of a small city — and the large AI training campuses now announced aggregate several halls into loads in the hundreds of megawatts, with some proposed gigawatt-scale projects on paper. The Department of Energy-commissioned analysis by Lawrence Berkeley National Laboratory found data centers consumed roughly 4 percent of US electricity in 2023, a share that had been near 1.5 percent a decade earlier. Every siting decision therefore begins as a power procurement problem: find a place where hundreds of megawatts of firm, reliable electricity can actually be delivered, at a price the economics tolerate.
02What a Good Site Actually Needs
The checklist is unforgiving. A site needs transmission access — proximity to high-voltage lines with available capacity — plus land cheap enough for hundred-acre campuses, water for cooling where evaporative systems are used, low seismic and flood risk, and proximity to fiber routes with the latency the customer base demands. State and local tax abatements can swing the operating cost by double digits, which is why governor offices court facilities with incentive packages. The intersection of all these constraints is a short list, and it rarely includes the coastal metros where the AI industry's people live. That is the structural reason data clusters form in places like Northern Virginia, central Ohio, and the plains states: not accident, but arithmetic.
03The Interconnection Queue Wall
The binding constraint has become time. Connecting a large new load to the transmission grid requires an interconnection study and agreement, and the queues at grid operators have swollen as renewable and storage projects — plus, increasingly, data centers — stack up behind limited study capacity. Lawrence Berkeley National Laboratory's annual queue research has found typical waits approaching five years from request to commercial operation for recent projects. A five-year queue means a developer signing a customer contract today is gambling on grid access in the early 2030s. Some operators now site behind existing energized substations or buy shuttered fossil plants for their interconnection rights — the grid equivalent of buying a house for the water rights.
Data centers' share of US electricity consumption, 2014 versus 2023, as reported by LBNL's 2024 Department of Energy analysis. Figures approximate.
04The Community That Didn't Expect a Neighbor
Here the engineering problem becomes a political one. The optimal site on paper — cheap land, cheap power, willing county government — is someone's township, and residents experience the facility as noise, water draw, tax giveaways, and flattened farmland rather than as latency. The backlash that has surfaced in county zoning hearings across the country, and examined in the source video from the community's side, is not primarily anti-technology sentiment; it is a complaint about process — deals negotiated before residents knew a project existed, incentives that shift the cost-benefit calculus, and growth that outpaced the local ability to regulate it. The video's core observation is that both sides are describing the same facility as completely different objects: an economic lifeline to one constituency, an imposition on another.
05Why States Court What Towns Resist
The state-town divergence is one of accounting. A state sees construction payroll, property tax base, and a claim on the AI economy; the county sees road wear, school crowding from construction crews, and electricity rate pressure. Rate pressure is not hypothetical: in regions where data centers have clustered, utility filings have passed capacity costs to all ratepayers, and state regulators from Georgia to Virginia have begun scrutinizing who pays for growth. States respond with incentive packages and expedited permitting; some have also begun demanding cost protections for existing ratepayers. The siting map is thus drawn twice — once by engineers, once by legislatures — and the facilities get built where both maps overlap.
Typical US grid interconnection duration from request to commercial operation, by project cohort, per LBNL's interconnection queue research. Values are reported approximations; durations vary by region and queue.
06The Gap Between Announced and Energized
The announcements and the electrons are on different schedules. Gigawatt-scale project headlines routinely describe multi-campus buildouts phased over a decade, contingent on interconnection agreements, water permits, and demand actually materializing — meaning the AI buildout visible in press releases is a portfolio of options, not a construction schedule. This gap cuts both ways. Skeptics correctly note that much of the announced capacity will slip or shrink. Grid planners correctly note that even the energized fraction is large enough to reshape regional load forecasts that utilities had treated as flat for two decades. The honest read of 2026: the siting constraint is real, the backlog is real, and the buildout is nonetheless proceeding at a pace the US grid has not accommodated since the postwar boom.
07What the New Geography Means
The long-run consequence is a redistribution of both infrastructure and leverage. Counties that once had no economic claim on the tech industry now host its physical plant, and they are learning — sometimes clumsily — to negotiate. Utilities are being pushed toward capacity-first planning for the first time in a generation. And the industry itself is discovering that its constraint has moved from chips to electrons: compute is only as good as the megawatts behind it, and the megawatts have to come from somewhere with lines, water, and a community that was consulted in time. Where AI physically lives turns out to be one of the most consequential — and least glamorous — questions of the decade.
The siting problem compresses to one line: AI's economics are set in data centers, and data centers' economics are set by the grid. Whoever solves power delivery — not model architecture — will set the pace of the next phase of the buildout.
References
- Shehabi, A., et al. (2024). 2024 United States Data Center Energy Usage Report, Lawrence Berkeley National Laboratory, prepared for the US Department of Energy (data centers about 4 percent of US electricity in 2023). eta.lbl.gov
- Lawrence Berkeley National Laboratory. Queued Up: Characteristics of Power Plants Seeking Transmission Interconnection (interconnection duration analysis). emp.lbl.gov/queues
- Wikipedia. Data center. https://en.wikipedia.org/api/rest_v1/page/summary/Data_center
- US Department of Energy. Data center energy reports and grid planning analyses. energy.gov
- Elephants in Rooms - Ken LaCorte. What's really behind the data center backlash?. YouTube. https://www.youtube.com/watch?v=DfaKAtTXurY (~556,000 views, observed 2026-08-31)
By N43 and Hermes for Sailor Bob News.