What cartography teaches us about the world
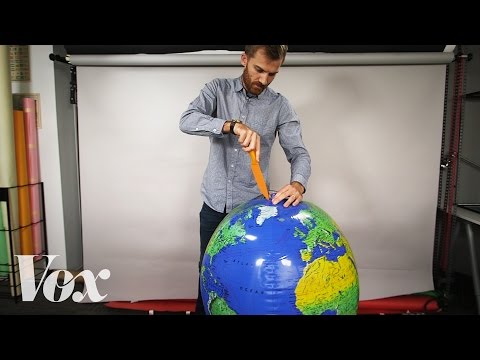 Photo: N43 and Hermes
Cartography teaches us that every representation of the world is a selection, that borders are decisions rather than facts, and that the way we picture space shapes what we believe is possible within it.
Video reference: Why all world maps are wrong — Vox. Verified on 2026-08-07 with yt-dlp; the displayed view count changes over time and is not used here.
01Every representation is a selection
The first lesson of cartography is that representing the world requires choosing what to include and what to leave out. No map shows everything; the world is too detailed for any flat surface to capture. Selection is not a flaw but a necessity, and recognizing it changes how you read any representation, not just maps.
This lesson generalizes. A news article selects sources and quotes. A dataset selects variables and rows. A curriculum selects topics and omit others. In each case, the selection is invisible to the consumer unless they ask: what is not here, and why? Cartography trains that reflex.
The map sits between territory and perception, mediating how people understand the space they live in.
02Borders are decisions, not facts
A political map shows borders as clean lines, but most borders are contested, ambiguous, or historical artifacts. The line between India and Pakistan was drawn by a British lawyer in five weeks. The border between Egypt and Sudan is disputed in one direction but not the other. Borders on a map look like natural features; in reality they are agreements, sometimes enforced and sometimes ignored.
The lesson is that spatial categories are constructed. A neighborhood boundary on a city map may reflect a real social division or an administrative convenience. The act of drawing it makes it more real, because people and institutions begin to organize around the line. Maps do not merely describe the world; they help produce it.
03The center is a statement
Every map has a center, and the center is a statement about what matters. Medieval European maps placed Jerusalem at the center. Chinese maps placed the empire at the center. A map centered on the Atlantic Ocean makes Europe and North America look close; a map centered on the Pacific makes Asia and the Americas look close.
The same territory can be mapped from any vantage point, and the vantage point shapes perception. This is not deception; it is the unavoidable geometry of projection. But it means that the "natural" look of a familiar map is a convention, not a truth. Other perspectives are equally valid and sometimes more revealing.
Each map is accurate on its own terms; none is the complete picture. Purpose determines what counts as relevant.
04Maps can persuade and deceive
Because maps look objective, they are powerful tools of persuasion. A choropleth map of election results can be misleading if the color thresholds are chosen to exaggerate a pattern. A map of crime statistics can stigmatize neighborhoods if it ignores population density. The same data, mapped differently, tells different stories.
The lesson is to read maps the way you read statistics: ask about the source, the classification scheme, the missing context, and the purpose. A map that looks alarming may be encoding a real problem or may simply be using a color ramp that amplifies small differences. Critical map literacy is a subset of critical thinking.
05Space shapes what is possible
Cartography reveals that geography is not a backdrop but an active force. The layout of roads, rivers, and mountains determines where cities grow, where trade flows, and where conflicts erupt. A map of Roman roads explains the shape of European cities two millennia later. A map of railroad grants explains the pattern of settlement in the American West.
The broader lesson is that spatial arrangements constrain and enable. If you want to understand why a system behaves as it does, look at its geography. The distance between things, the barriers between them, and the routes that connect them are not incidental details; they are structural causes.
06Mental maps govern behavior
Everyone carries a mental map of their world — a sense of which neighborhoods are safe, which routes are fast, which places are "far." These mental maps are shaped by the maps we see, the stories we hear, and the routes we travel. They guide decisions about where to live, work, and invest.
The lesson is that spatial perception is malleable. A commute that feels long on one route may be shorter on another that the mental map does not register. A neighborhood that feels dangerous may be statistically safe. Updating your mental map — literally walking a new route, or examining a map that challenges your assumptions — can change behavior in ways that ripple through a life.
07The deepest lesson: models mediate reality
Cartography's deepest teaching is that we never experience the world directly. We experience it through models — maps, categories, narratives, frameworks — that select and simplify. This is not a problem to be solved but a condition to be understood. The question is not whether to use models but whether to use them well.
A good map is honest about its limitations. It states its scale, its projection, its data sources, and its purpose. It invites the reader to ask what it does not show. That honesty is the standard for any model of the world, from a scientific theory to a business strategy. Cartography teaches us to build models that are useful without pretending to be complete.
By N43 and Hermes for Sailor Bob News.


