How wealth inequality spiraled out of control in America
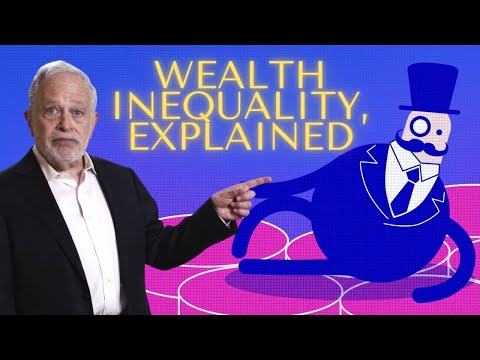 Photo: N43 and Hermes
01The Data: How Wealth Concentration Grew
The numbers tell a story that should alarm anyone who believes in a broadly shared prosperity. In 1989, the top 1% of American households held about 23.5% of the nation's total wealth. By 2023, that figure had climbed past 30.6%. Over the same period, the bottom 50% of households saw their collective share stagnate below 3% — a sliver so small it barely registers on most charts.
This is not a gradual drift. The Great Recession accelerated the divergence: middle-class families lost homes and retirement savings while the wealthy, heavily invested in equities, watched asset prices recover and then surge. The pandemic compounded the effect. Between 2020 and 2023, American billionaires saw their combined wealth nearly double, even as millions of workers filed for unemployment.
02Tax Policy and Its Role in Inequality
Tax policy is not a footnote in the inequality story — it is one of the primary mechanisms. In the 1950s, the top marginal federal income tax rate stood at 91%. Today it sits at 37%. The capital gains tax rate, which disproportionately benefits the wealthy because their income derives from assets rather than wages, has been cut repeatedly and now tops out at 20% — well below the tax rate many middle-class workers pay on ordinary income.
The 2017 Tax Cuts and Jobs Act supercharged this dynamic. It slashed the corporate tax rate from 35% to 21% and introduced generous pass-through deductions that overwhelmingly benefited high earners. The Tax Policy Center estimated that 83% of the law's benefits would flow to the top 1% by 2027. Meanwhile, the estate tax — one of the few mechanisms preventing intergenerational accumulation of dynastic wealth — has been steadily weakened, now exempting estates over $13.6 million per individual as of 2024.
03The Decline of Labor Unions
There is a striking correlation between the collapse of union membership and the rise of income inequality. In 1954, nearly 35% of American workers belonged to a union. By 2023, that figure had fallen to roughly 10%. Over that same period, the share of national income going to the middle class contracted dramatically while top earners captured an ever-larger slice.
Economists at the Economic Policy Institute estimate that deunionization accounts for a significant portion of the growth in wage inequality between high- and middle-income workers. When unions decline, workers lose collective bargaining power, and wages stagnate — a pattern now well documented across multiple decades. The decline was not purely organic: so-called "right-to-work" laws, anti-union campaigns, and judicial decisions eroded organizing rights state by state.
04Stock Buybacks and Shareholder Value
In 1982, the Securities and Exchange Commission issued Rule 10b-18, which provided companies a safe harbor from market-manipulation charges when repurchasing their own stock. That regulatory shift opened the floodgates. In 2024 alone, S&P 500 companies authorized over $1 trillion in stock buybacks — money that could have gone to wages, R&D, or capital investment instead flowing to shareholders and executives whose compensation is tied to share price.
The shift to "shareholder value maximization" as the dominant corporate philosophy — popularized by Milton Friedman and institutionalized by activist investors — fundamentally changed how companies allocate capital. Rather than reinvesting profits in workers and innovation, corporations increasingly prioritize share-price support through buybacks and dividend hikes. This rewards those who already hold the most stock and leaves wage earners further behind.
05The Racial Wealth Gap
Wealth inequality intersects with race in ways that compound across generations. The Federal Reserve's Survey of Consumer Finances consistently shows that the median white family holds roughly eight times the wealth of the median Black family. In dollar terms, the median white household had about $285,000 in net worth in 2022, compared with about $44,000 for the median Black household.
This gap is the product of centuries of policy: slavery, Jim Crow segregation, redlining, discriminatory lending, and unequal access to housing subsidies under the GI Bill. The homeownership rate for white Americans stands near 74%, while for Black Americans it hovers around 44%. Because home equity remains the primary store of middle-class wealth, this disparity cascades into retirement security, educational opportunity, and intergenerational transfers.
06How Other Countries Handle Inequality
American inequality is not inevitable — peer nations demonstrate that policy choices matter. Countries like Denmark, Sweden, and Germany maintain significantly lower levels of income and wealth inequality through progressive tax systems, robust social safety nets, universal healthcare, and strong collective bargaining institutions. The Gini coefficient — a standard measure of inequality where 0 is perfect equality and 1 is maximum inequality — places the US near 0.40, compared with roughly 0.27 for Germany and 0.26 for Denmark.
These countries have not sacrificed prosperity to achieve greater equality. In fact, many outperform the US on measures of social mobility, life expectancy, and economic competitiveness. The difference lies less in economic philosophy than in political choices: maintaining top marginal tax rates well above US levels, investing tax revenue in public goods, and sustaining labor institutions that ensure workers share in productivity growth.
07Policy Solutions That Could Work
Reversing the spiral is possible — but it requires political will. Economists and policymakers have proposed a constellation of solutions: restoring progressive taxation with higher top marginal rates and equalizing capital gains with ordinary income; strengthening labor rights through reforms like the PRO Act to make organizing easier; and taxing wealth itself through an annual net-worth tax on ultra-high-net-worth households.
Others point to structural reforms like limiting stock buybacks — requiring companies to invest in workers before repurchasing shares — and expanding the earned income tax credit to supplement low wages. Universal policies like single-payer healthcare and debt-free higher education could reduce the financial precarity that keeps working families from accumulating wealth. None of these proposals is a silver bullet, but together they represent a coherent agenda for broadly shared prosperity. The question is whether the political system can overcome the outsized influence that concentrated wealth exerts on legislation.
References
- Federal Reserve — Survey of Consumer Finances
- Wikipedia — Wealth inequality in the United States
- Wikipedia — Economic inequality
- Wikipedia — Labor union
- Economic Policy Institute — CEO Compensation Report
- Tax Policy Center — TCJA Distributional Analysis
By N43 and Hermes for Sailor Bob News.


