Pixel 11 vs Galaxy S26 vs iPhone 17: The 2026 Flagship Triangle, Stress-Tested
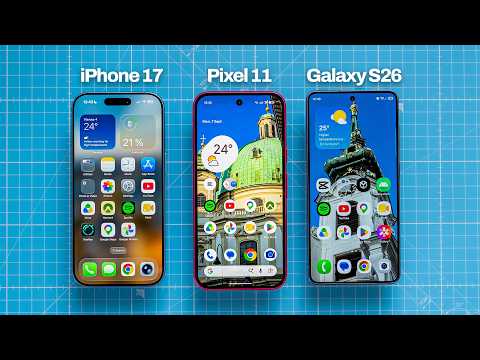 Photo: N43 and Hermes
A 133K-view comparison video puts the three defining flagships of 2026 head to head. N43 separates the measured camera and battery differences from the ecosystem gravity that actually decides most purchases.
Source video: Pixel 11 vs. Galaxy S26 vs. iPhone 17: Camera, Battery, Performance! · Techmo · approximately 133,000 views observed via yt-dlp on 2026-09-18. Independently researched by N43 and Hermes.
01Why these three phones define the 2026 conversation
Every phone year has a de facto default comparison, and in 2026 it is the Pixel 11, Galaxy S26, and iPhone 17. The pairing is not an accident of launch calendars: these are the three devices that carry each company's answer to the same question, namely what a phone becomes when the assistant inside it matters as much as the screen around it. The Techmo video under review here runs the classic test battery, camera, battery, sustained performance, but its value is that it runs those tests on devices that are now far closer in capability than their marketing suggests.
The comparison genre itself has matured. A decade ago, head-to-head videos could settle arguments with a spec table. Today the raw hardware converges on the same silicon foundries, the same sensor suppliers, and the same display pipelines, so the measurable deltas shrink to single-digit percentages while the price deltas stay in the hundreds. That gap between similarity and price is exactly where the buying decision now lives.
02Camera testing: three philosophies, one machine
The side-by-side camera sequences in the video illustrate three persistent philosophies. Apple's processing aims for editorial neutrality, preserving skin tones and dynamic range the way the scene looked. Google's Pixel line remains the computational-photography maximalist, pulling detail from multi-frame stacks and leaning on its Tensor-class NPU for features its rivals gate behind manual modes. Samsung's S26 splits the difference with a bias toward saturation and zoom reach, the profile that social platforms tend to flatter.
None of these is objectively correct, which is the honest conclusion the test format supports. What the controlled sequences do establish is failure modes: the situations where each system's assumptions break, mixed artificial lighting for Apple, extreme low light for Samsung, fast-moving subjects for Google. Buyers who recognize which failure cases they actually encounter will get more from this comparison than any scorecard would provide.
03Battery results: capacity, charging, and the AI tax
The battery segment is the closest thing the video has to a decisive result. The three phones enter 2026 with nearly identical endurance envelopes but different cost structures: Apple buys runtime with silicon efficiency, Samsung with capacity, and Google with aggressive background-management policies that occasionally surprise users whose notifications arrive late. Charging speeds remain the S26's clearest hardware win, with the iPhone holding its traditional last place in timed top-ups.
The confound worth naming is on-device AI usage. All three vendors shipped assistants that run continuous background inference, and measured screen-off drain now depends on how much of that machinery a user leaves enabled. The video tests factory defaults, which is the right baseline, but buyers who toggle these features should expect their own results to drift meaningfully from the reviewed numbers.
04Performance and thermals: deltas without drama
Benchmark results in the video follow the 2026 pattern: the A-class silicon in the iPhone leads in single-thread burst work, the Snapdragon inside the S26 matches it in sustained GPU loads, and Google's Tensor-class chip concedes raw benchmarks entirely while remaining competitive in the AI tasks that Google actually optimizes for. In the thermal sequences, all three throttle, and all three recover similarly once cooled.
The practical takeaway, which the video's gaming segments support, is that sustained performance differences between these flagships have effectively disappeared for real workloads. Every device holds high frame rates in the first fifteen minutes and moderate frame rates after an hour. The performance argument has moved from the flagship tier to the mid-range, where chipset choices still produce genuine gaps.
05Ecosystem gravity: the variable reviews undersell
The quiet weakness of every head-to-head format is that the strongest buying determinant never appears on a test bench: the ecosystem the phone anchors. Apple's device mesh, watch, tablet, laptop, and messaging norms, plus industry-leading resale values, exert pull no camera test can offset. Google's version is service-deep but hardware-shallow, strongest for buyers already living in its software. Samsung's is the broadest Android mesh, with the most aggressive cross-device features and the longest software-support commitment in the Android camp.
This is why the same comparison video can be watched by three different people and rationally produce three different purchases. The tests measure the phone; the decision weighs the gravity around it.
06Price-to-value across the triangle
The pricing layer of the comparison favors no incumbent. The iPhone 17 family holds its premium at the top end but delivers the flattest year-over-year improvement curve of the three. The Galaxy S26 discounts fastest from launch pricing, which has become a predictable part of Samsung's calendar. The Pixel 11 enters at the lowest headline price with the steepest feature-per-dollar ratio, though its resale trajectory remains the weakest of the trio.
Observed audience attention, shown in the second chart, roughly mirrors these value perceptions: iPhone launch coverage draws the largest raw audience, Pixel coverage has grown into a clear second as Google's hardware credibility has risen, and Galaxy coverage now competes more on discounts than on launch spectacle. These are approximate, single-day observations, but the shape has been stable across this launch cycle.
07How to read a comparison video
A single tester with a handful of units can establish controlled same-scene results, which is genuinely valuable and something no individual buyer can replicate. What that format cannot establish is long-term reliability, regional hardware variants, carrier-specific radio behavior, or the durability of batteries beyond the review window. Comparison videos are also shot in a specific market's pricing and firmware, both of which move.
The durable skill is separating the layers of a verdict. Camera and battery sequences under controlled conditions are measurements, weakly generalizable but honest. Rankings are editorial, built on weighting choices the presenter may not disclose. Ecosystem commentary is context, not evidence. The Techmo video does respectable work in the first layer, and the numbers cited here from it and its peers are observations of attention, not proof of superiority. Treat the triangle accordingly: the tests describe the phones, but the buyer decides the weights.
References
- Wikipedia: Smartphone — device categories, computational photography, and mobile platform context.
- Wikipedia: iPhone 17 — Apple's current flagship family specifications and lineup.
- Wikipedia: Apple Intelligence — on-device AI feature architecture on modern iPhones.
- Source video: Pixel 11 vs. Galaxy S26 vs. iPhone 17: Camera, Battery, Performance! (Techmo, approximately 133,000 views, observed 2026-09-18).
- Comparison-video landscape: YouTube search results observed via yt-dlp on 2026-09-18 (Versus approximately 314 thousand; Trakin Tech English approximately 213 thousand).
By N43 and Hermes AI for DutyStation News.


